Side Project: Drift
Overview
While developing my other side project, Mealer, I have gotten a lot of exposure to software engineering, especially with respect to REST APIs and React. However, across all of my co-ops and courses, I arguably have more experience with data, and I feel like there are many skills for me to further hone and learn in this field. Thus, my inspiration for Drift was born.
Drift is a reproducible pipeline that integrates longitudinal census, housing, and urban activity data to construct tract-level indicators of neighbourhood change, exposed through an interactive dashboard. Though initially inspired by the idea of tracking gentrification within Toronto, gentrification has no universal definition and is not observible in raw data. My hopes is that by modelling income change over time, analyzing variables like housing, education, and demographics, and examining how these vary across space, users can come to their own conclusions on what is happening across Toronto. It is my goal that this dashboard could be used to support policy creation, decision making, and research.
This project presents a wide variety of interesting challenges for me, including but not limited to multi-source data integration, spatial analysis, longitudinal analysis, schema design, and pipeline reproducibility. By far the most challenging problem, however, that I expect to tackle is tract boundary harmonization (reconciling geospatial data over time).
I hope to have a MVP of this project deployed by the end of August!
System Design
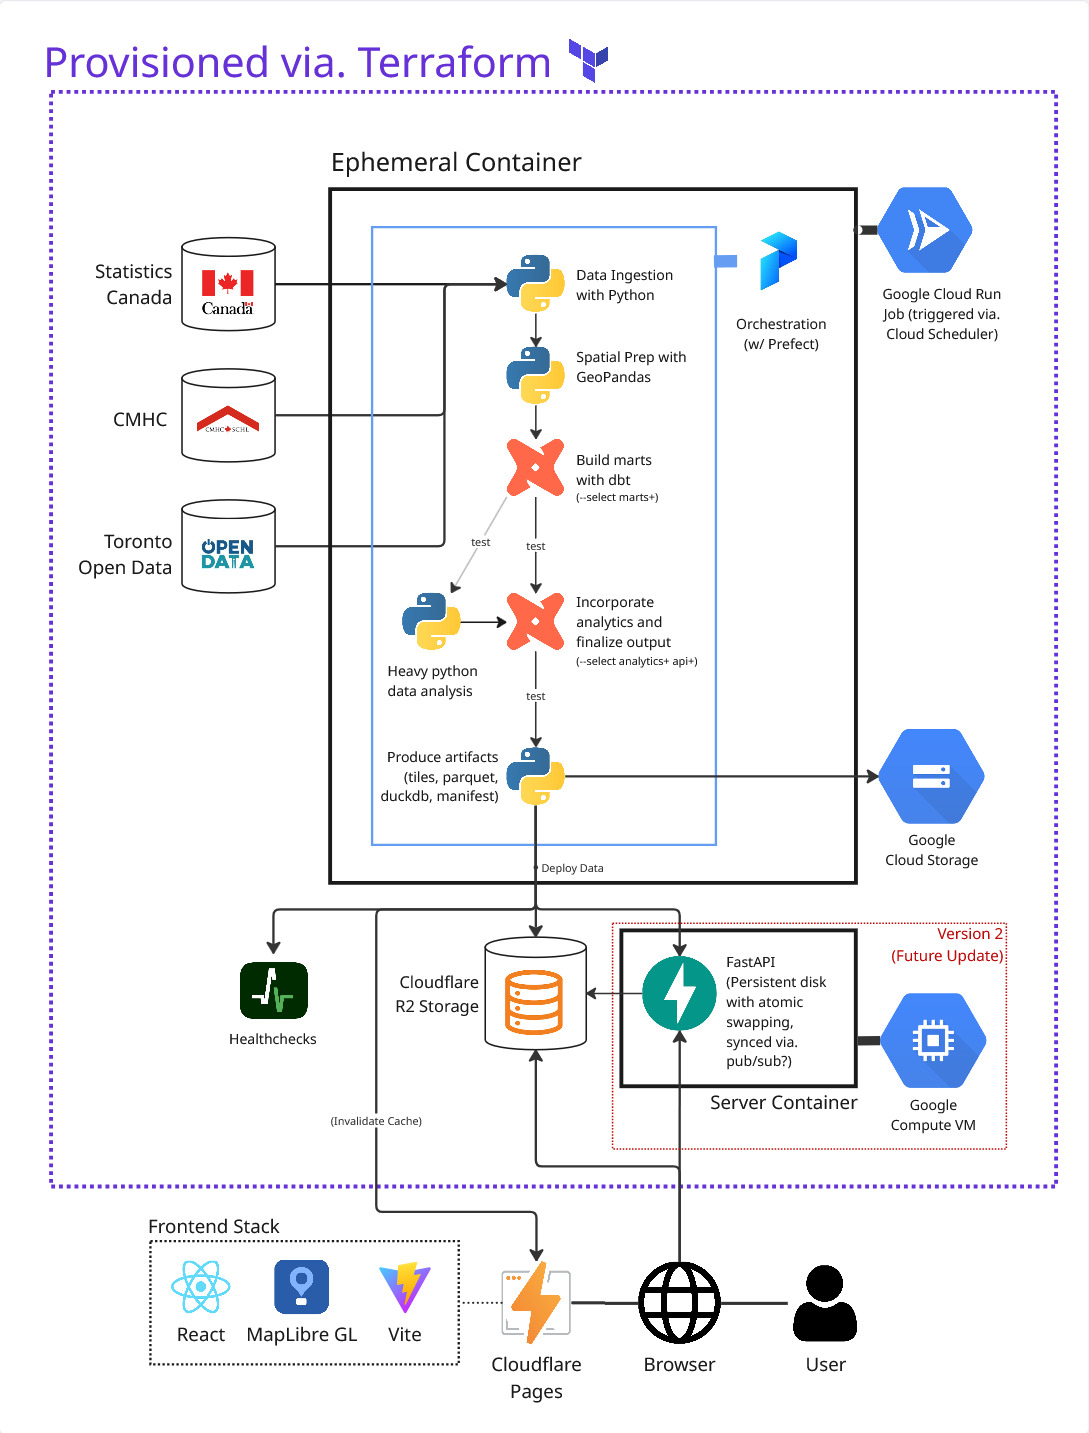
This system design diagram effectively shows what infrastructure and tools I plan to use, but not how I’m going to use and implement these tools. Continue reading for more info!
Explanation and Rationale
Cadences and Ephemeral Containers
Drift’s data sources update on very different schedules: Census every five years, CMHC monthly, Toronto Open Data daily-to-weekly. Rather than force everything through one pipeline, I plan to treat Census releases as events, not routine refreshes, as they can introduce significant changes in geography, schema, or methodology that benefit from human review. Drift will use two refresh paths: an automated monthly pipeline for regular sources, and a manual Census refresh each time a new Census is released.
The monthly pipeline will combine the latest validated Census baseline with newer housing and municipal data. Because this pipeline runs infrequently, I will have it run in ephemeral container that spins up, builds artifacts, and shuts down instead of an always-on virtual machine. This will enable powerful compute with minimal costs.
The Role of dbt and Python
I plan to use both dbt and Python in my data pipelines because they solve different parts of the problem. dbt handles repeatable analytical modelling: staging, intermediate, and mart tables, plus tests, documentation, and lineage. Python handles work that doesn’t fit dbt’s SQL-first model, specifically GeoPandas for spatial preparation and specialized analytics like Geographically Weighted Regression (GWR) for the manual Census refresh pipeline, which is computationally expensive.
Prefect will coordinate these pieces, keeping dbt focused on modelling and validation while still supporting heavier statistical work.
Serverless Unless Otherwise Needed
A traditional API server could add unnecessary complexity. The data is public, precomputed, and needs no authentication, so the frontend doesn’t need to query FastAPI for every result. Therefore, the first version of my pipelines will publish versioned artifacts: PMTiles and JSON for the dashboard, Parquet and DuckDB for reproducibility and downloads. The frontend will then read them from Cloudflare R2, leveraging its CDN capabilities.
DuckDB remains valuable as the analytical engine behind the pipeline, but the public dashboard doesn’t need a live database server yet. A second version may introduce FastAPI if users need dynamic queries that can’t be precomputed or handled client-side.
Takeaway
Let the data and dashboard requirements determine the infrastructure.
That’s why Drift will treat major census updates as reviewed events, run monthly refreshes in ephemeral containers instead of a virtual machine, use dbt and Python for what each does best, and serve static, versioned artifacts for as long as all front-facing data is precomputed.
Inspiration
- UNI-CEN: Dashboard for tracking Census data across Canada
- Exploring Patterns of Gentrification in Toronto (2001 to 2016) Through GWR: Thesis paper that demonstrates a methodological approach to analyze gentrification in Toronto